![]()
Graph Reports
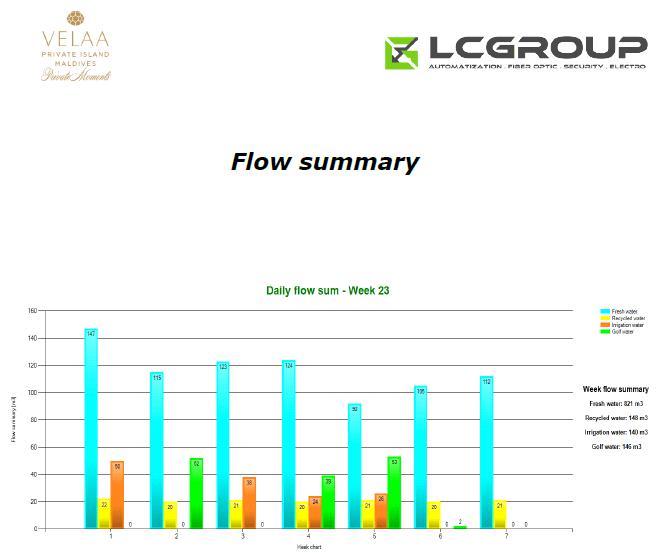
- island-system generates daily summary graphs of production, storage and issuance at specified intervals - e.g. monthly report of daily fuel consumption flow for diesel generators.
- well-arranged graphs allow information comparison with other databases outside of the system - e.g. weekly drinking water consumption dependance with hotel resort occupation.
← Daily Water Flow within a Week
Remote Support
- Remote inspection of Island-systems functionality and Service via Virtual Private network (VPN).
- Continuous optimization of the system that reflects actual demands.
- remote assistance for the system maintenance.
Remote system monitoring →